# The "Sociogram" Tool
Keywords: Sociogram tool, relationship network, system representation, network analysis, conflict resolution
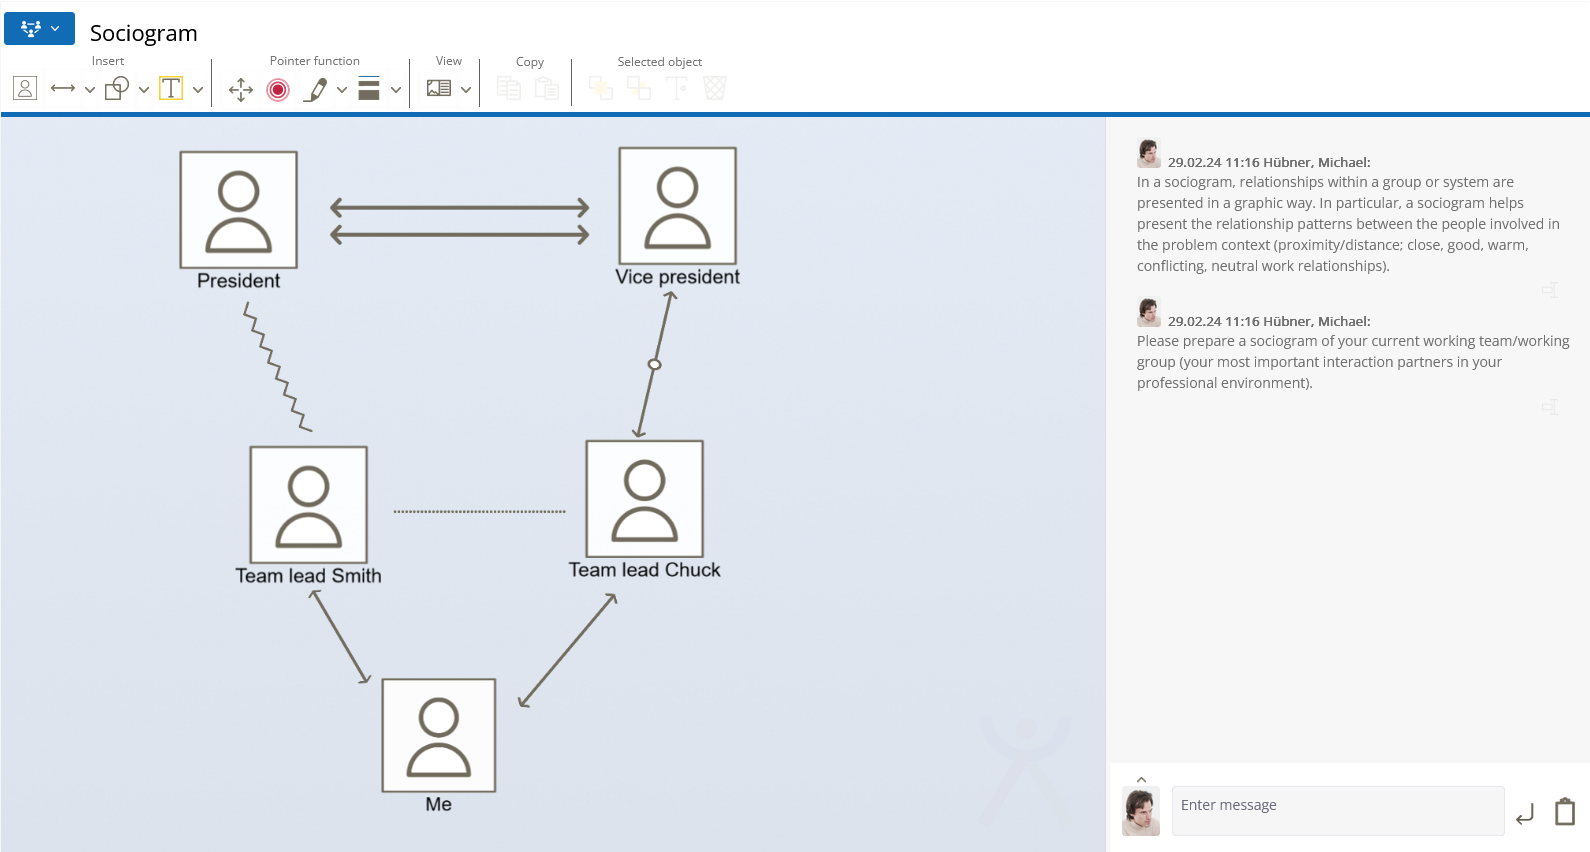
A sociogram is a graphical representation of the relationships within a group or another system. It is used to visualize specific relationship patterns between the individuals involved in a problem context (e.g., closeness/distance; close, good, warm, conflictual, or neutral relationships). Relationships between individuals are represented by lines.
# Tool-Specific Buttons
The tool provides specific functions to define actors and their relationships to one another:
# Person Add Person
Click the "Person" icon to add a new member to the sociogram.
- After clicking, a dialog box opens.
- Enter the name or label for the person here.
# arrow_range Relationship Between Two People
Use the drop-down arrow next to the arrow symbol to access various types of connections. You can choose from the following relationship types:
- Good relationship
- Alliance
- One-sided relationship
- Unknown / Undefined
- Love relationship
- Irritation line
- Hidden conflict
- Open conflict
# sticky_note Text Box
Add further information about the individuals and their roles using additional text boxes.
# Element Handling
# Adding and Adjusting Relationship Lines
When you insert a relationship line, you can position it flexibly within the workspace:
- Resizing: Use the blue circles at the corners of the element to adjust the length.
- Rotating: Use the protruding handle at the top to rotate the line to the desired angle.
- Positioning: Move the line so that it lies exactly between the relevant persons.
# Further Information
Related Topics
Basic operations (drawing, moving, deleting) are shared by all graphical tools. You can find details here: General Functions of Graphical Tools